
Research Reports: Increased tropical cyclone activity during a cold period?
"Intensified tropical cyclone activity in East Asia during the Maunder (solar) Minimum"

I came across this paper by Lin et al. (2025) [1] the other day and immediately moved it to the top of my paper queue. Much of my paleotempestology research has focused on the Gulf Coast for several reasons, including proximity and the legacy of certain storms (e.g., Hurricane Katrina). However, I am always looking for avenues to expand my work into the western Pacific Ocean, a region that is easily the tropical cyclone (TC) equivalent of Tornado Alley. Likewise, I am always looking for new paleoclimate proxies to incorporate into my work, so I enjoy exploring studies that expand my work beyond sediment and tree-ring records. In this case, Lin et al. (2025) [1] leverage the written/historical record to develop a paleotyphoon record spanning 600+ years! (More on this later.) From their record, they notice a distinct increase in tropical cyclone activity during a period of low sunspot activity (Maunder Minimum) during the Little Ice Age (~1300–1850 CE). Not exactly intuitive, which makes this an interesting paper. But before we dive into this study, I would like to provide a quick background on the Maunder Minimum.
Maunder Minimum: Sunspots and Climate
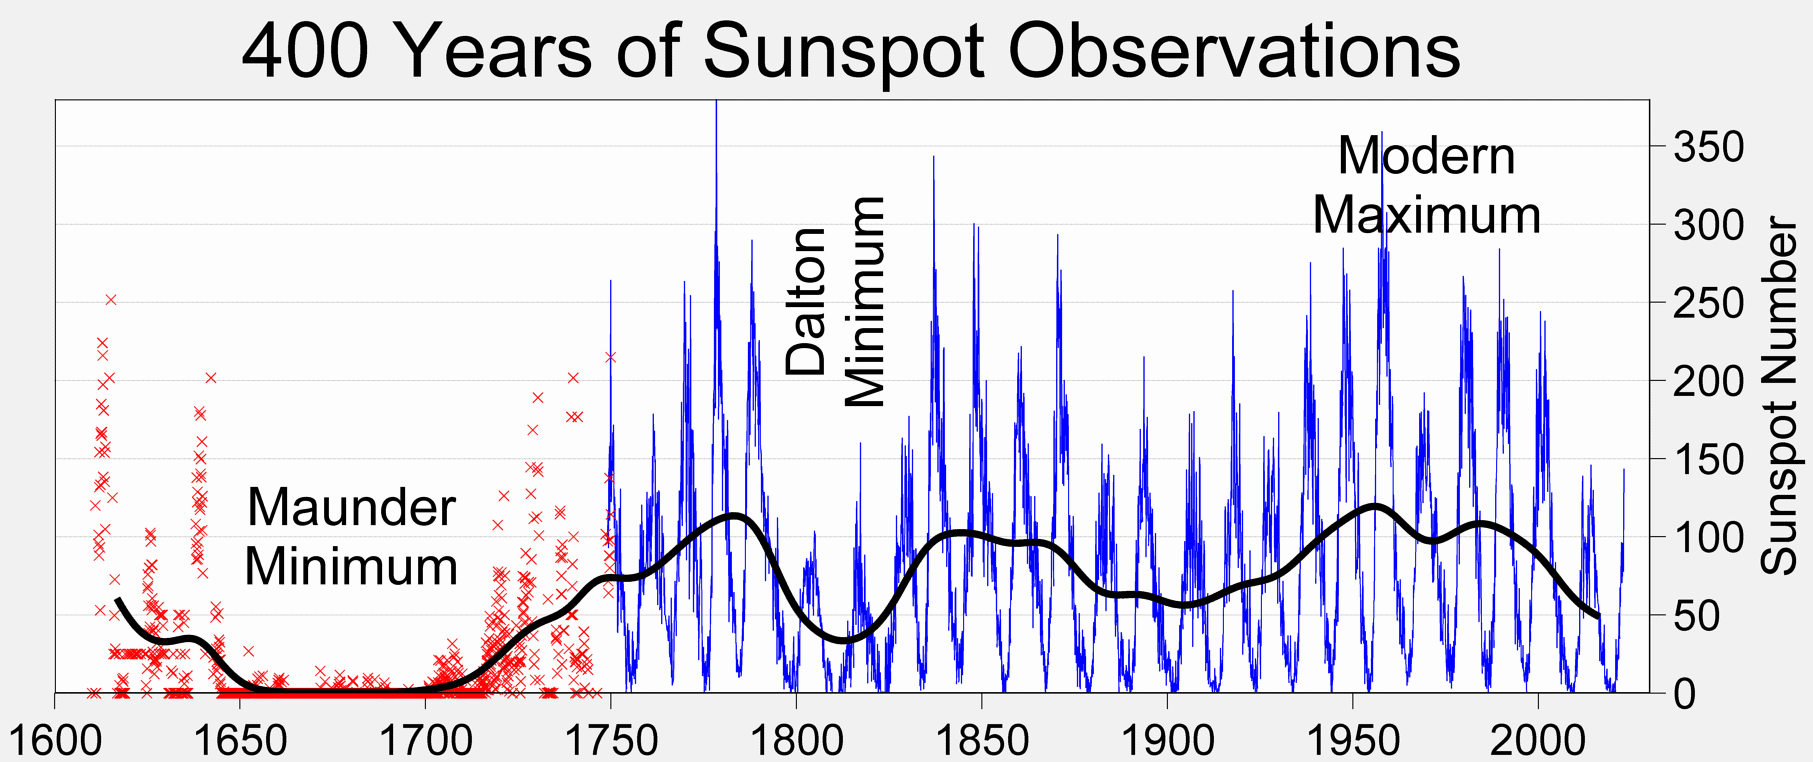
The Maunder Minimum (~1645–1715 CE) was a period of historically low sunspot activity, with some years exhibiting fewer than 50 sunspots. What exactly are sunspots? They are dark spots on the Sun's surface that are cooler than the surrounding surface. (This is relative because sunspots are still hot, with their center reaching 3500–4000 K; 3227–3727 °C; 5840–6740 °F.) To my understanding, they form when the magnetic field reduces convection, thereby reducing energy transfer to the surface, resulting in cooler surface temperatures. (As I am not a heliophysicist, this is definitely a gross oversimplification.)
The solar cycle has a periodicity of ~11 years, as shown in Fig. 1. Other cycles of solar activity of varying lengths also occur.
I find the anomalies rather interesting, as they do not exhibit a clear cycle. It is possible that longer periodicities occur in solar activity, though I have not explored this. There was a study that examined solar activity over the last 11 ka, though the focus was on trends rather than periodicities [3].
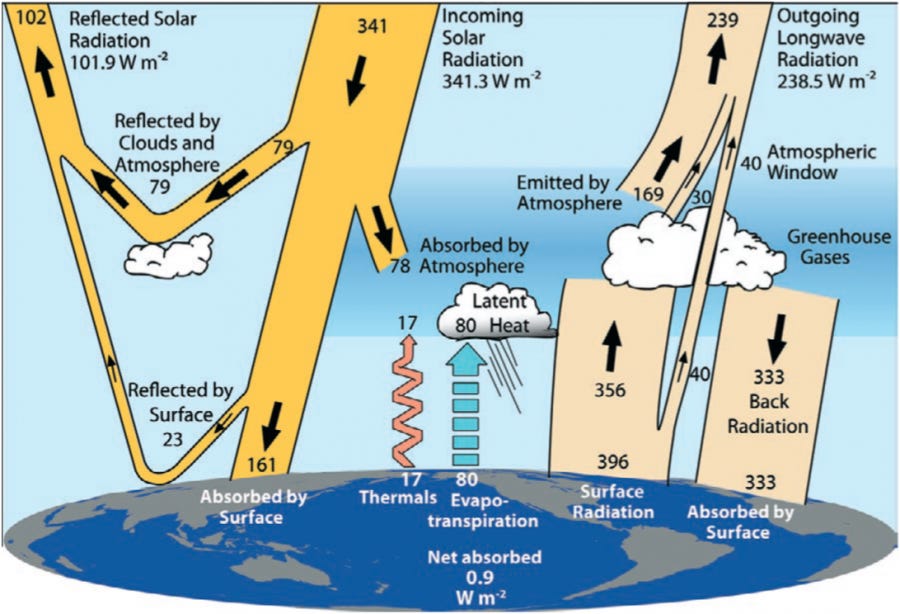
Why do we care about solar activity? The number one reason is that it drives our climate system (Fig. 2). The Sun is the source of incoming solar radiation (sometimes called “insolation”) and is an example of an external forcing of the climate.
Insolation is a shortwave radiation, meaning it is very energetic. The majority of outgoing radiation is less energetic (longwave radiation) as it is what was absorbed by Earth. Ideally, incoming and outgoing are equal to one another. However, when the amount coming in exceeds the amount leaving, this leads to warming. Cooling occurs when outgoing exceeds incoming.
So, what do sunspots have to do with the climate? They predominantly change solar irradiance levels, though not by a lot. When sunspot numbers increase, solar energy output increases, and vice versa. Somewhat unintuitive considering the temperature changes, but again, I am not a heliophysicist, so I will not get into the physics of this. The important thing to remember is that the two are correlated.
As shown in Fig. 1, there was a distinct period of low sunspot counts beginning in the mid-1600s. This was the Maunder Minimum. This coincided with a notable drop in solar insolation (Fig. 3).
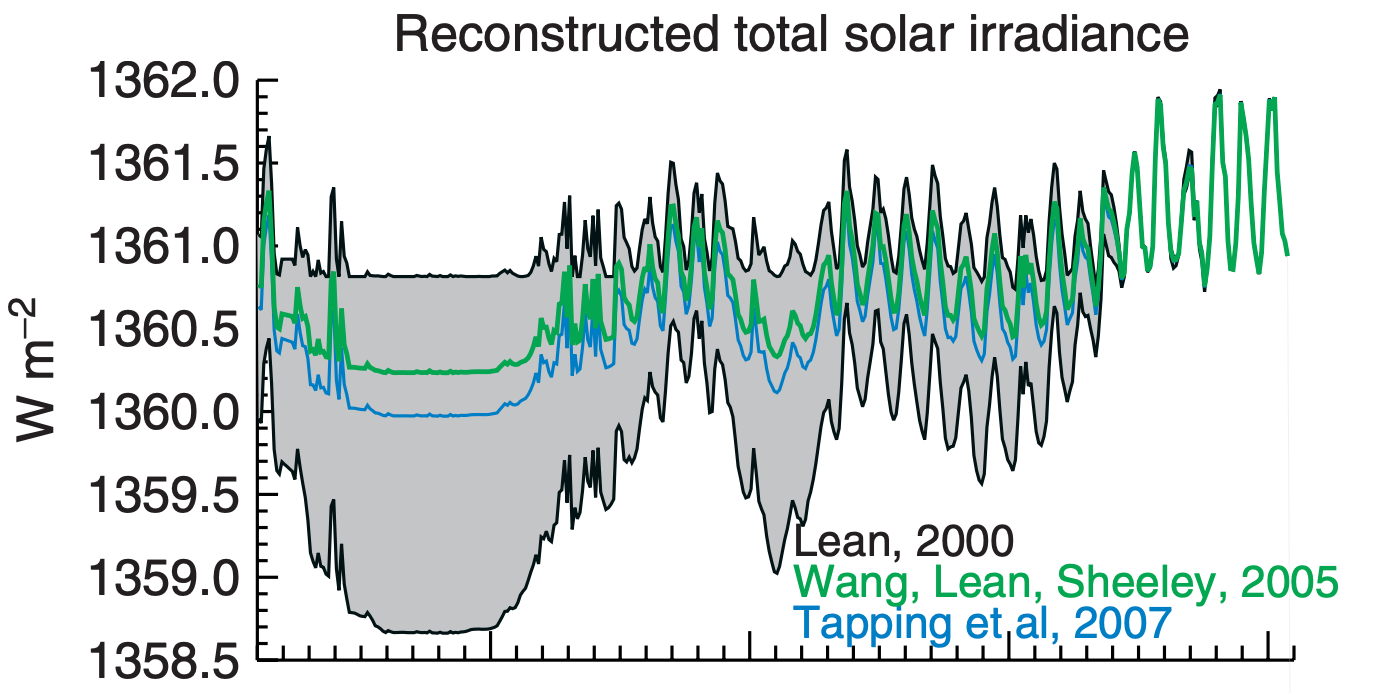
This interval was also the coldest period of the LIA. Now, there was also a series of (tropical) volcanic eruptions (another external forcing) around this time. These eruptions would have ejected large amounts of aerosols and particulate matter, blocking incoming solar radiation. As a result, there is considerable debate over the extent to which the Maunder Minimum influenced global temperatures. Okay, that was a lot, but I think this serves as an okay overview of the Maunder Minimum and sunspots.
East Asian Typhoons During the Maunder Minimum
The paper that I am covering is “Intensified tropical cyclone activity in East Asia during the Maunder (solar) Minimum” by Lin et al. (2025), published in the Proceedings of the National Academy of Sciences [1]. Let’s start off by answering the following question: Why do we care? If you have read prior posts, you are familiar with the limitations of the instrumental record, particularly with regard to its length. These limitations become more pronounced elsewhere in the world, such as in East Asia, where the most comprehensive and reliable dataset, IBTrACS, only goes back to the late 1940s or early 1950s. This is baffling, given that the Pacific, especially the western North Pacific, is the world's most active basin. Consequently, there is a dire need for pre-instrumental records of TCs in this region.
History or Prehistory?
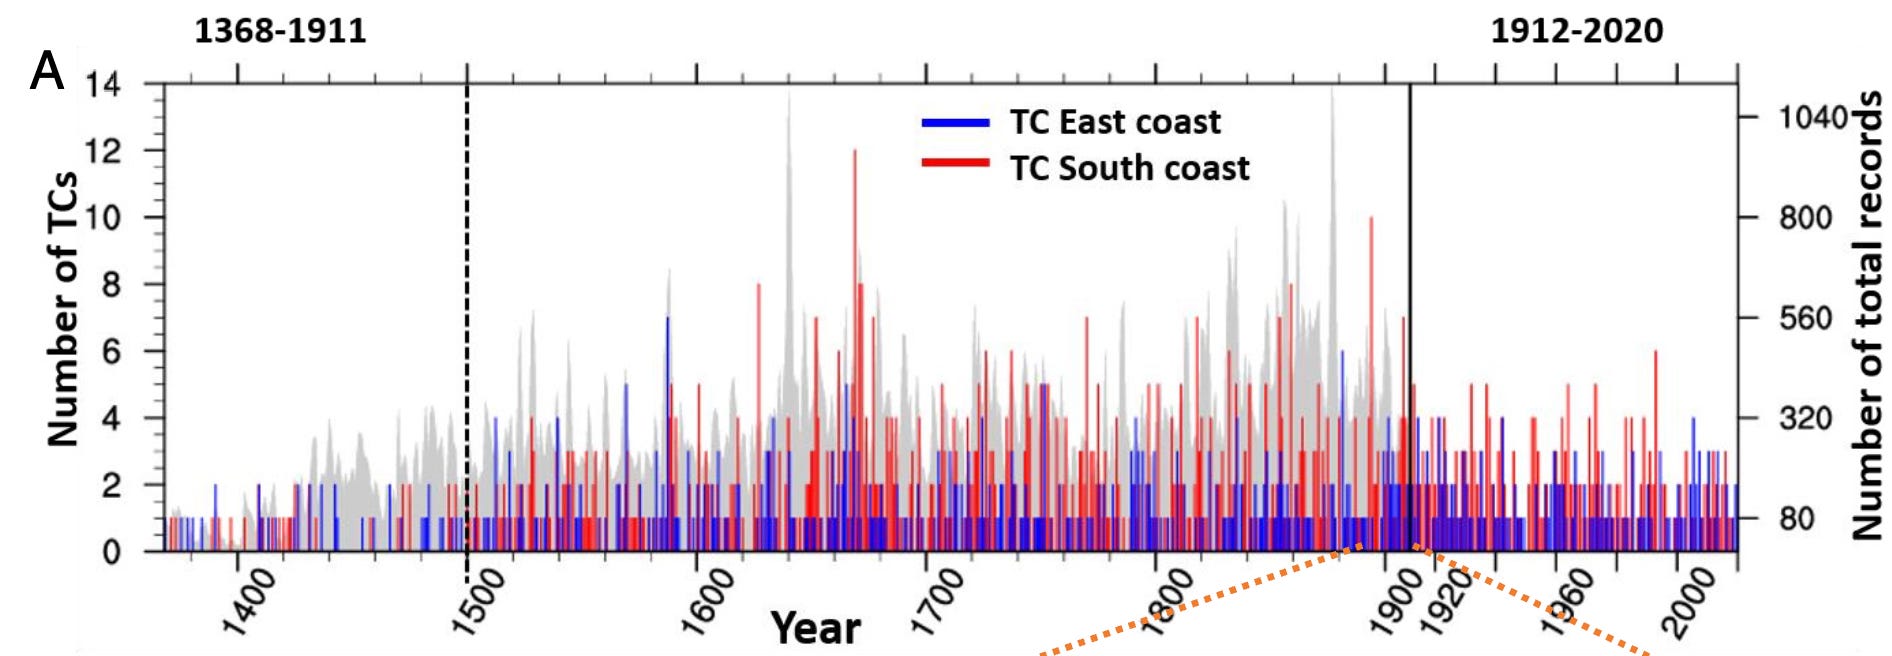
Many of our tropical cyclone reconstructions are developed using environmental proxies, e.g., tree rings, sediment, corals, etc. However, Lin et al. actually used written records to reconstruct TCs back to the 1300s (Fig. 4)! Think about that for a second: written records. This would, technically, be considered part of the historical record. (Side note: I have read multiple papers reconstructing typhoons over the last 1+ ka using written records. The longest that I can recall right now is 2 ka [4], though there might be longer written records. That is simply not possible in the western North Atlantic.)
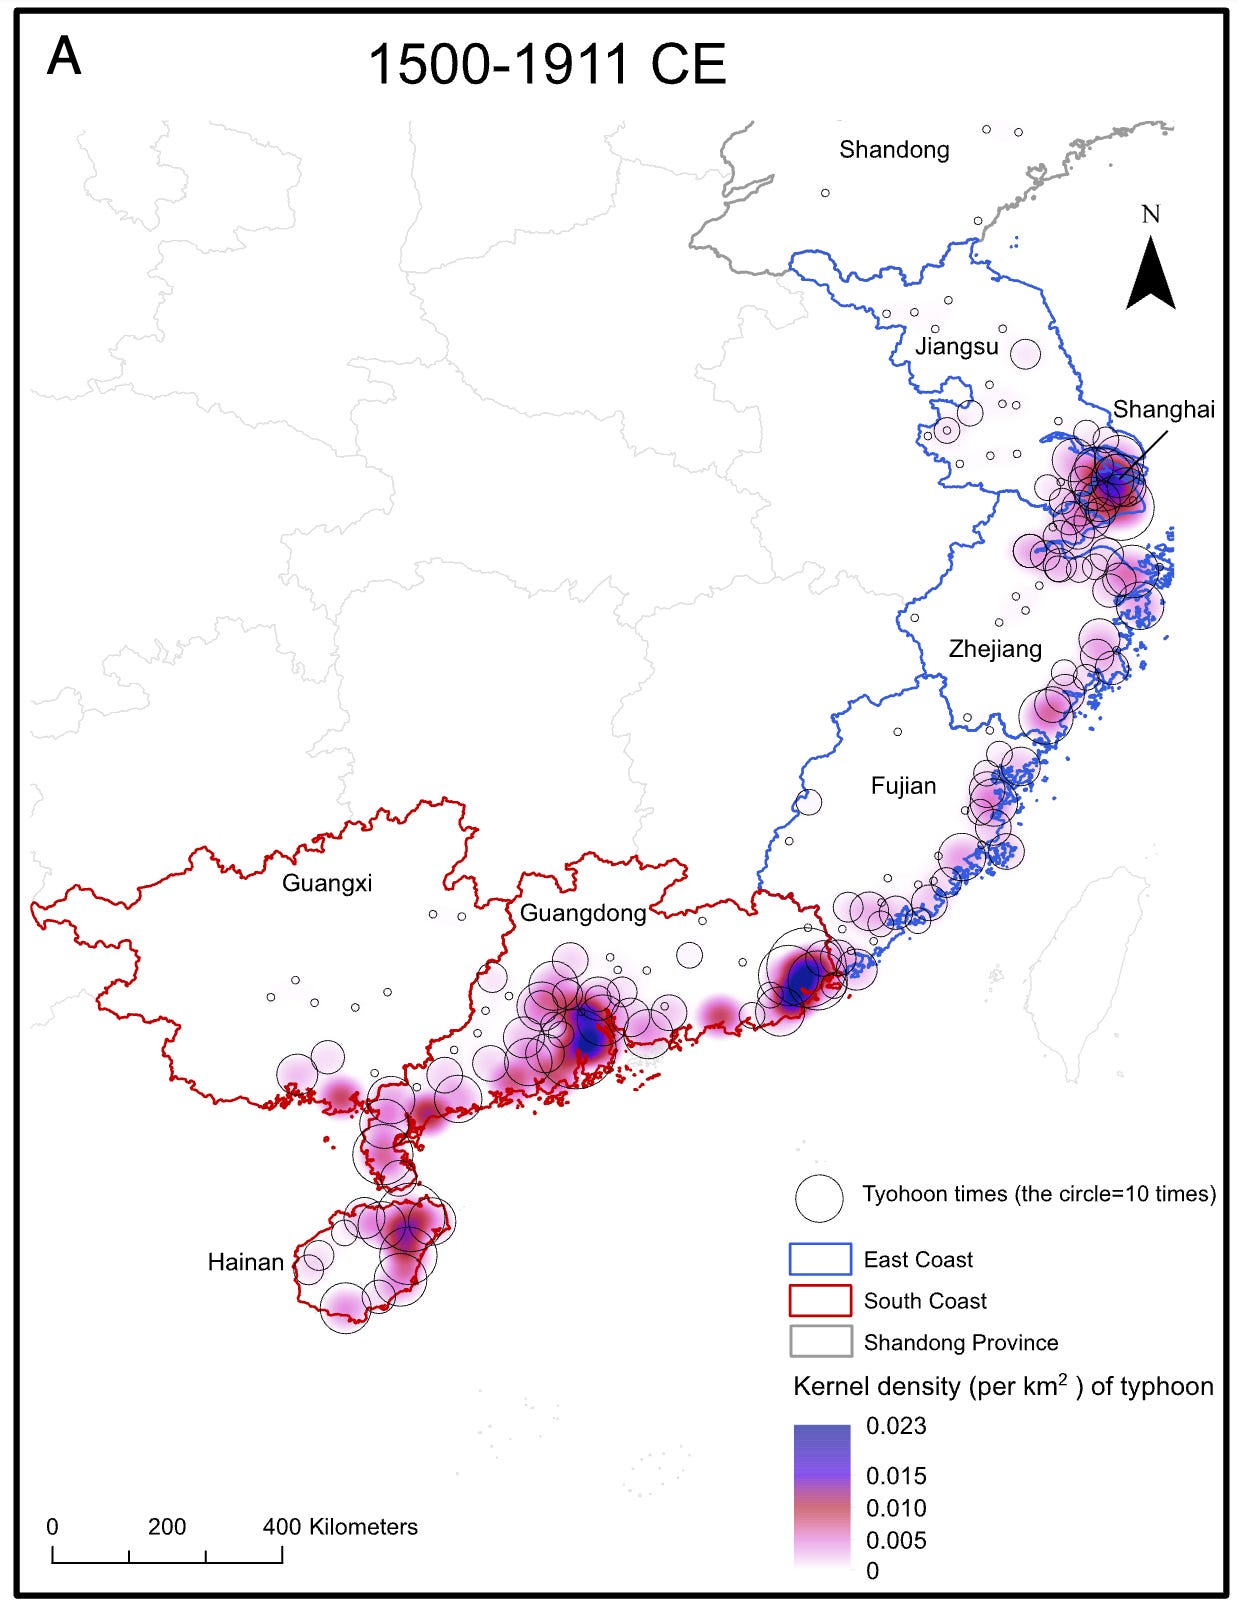
Now, they limit their record to just 1500 CE to the present, so all analyses exclude anything prior to 1500 CE. They also examined only landfalling storms along the eastern and southern coasts of China (Fig. 5).
Spatial Patterns of Tropical Cyclones
Out of a total of 1081 TCs, the vast majority (65 %) were found to have made landfall in the southern study region, whereas only 34 % made landfall in the eastern region (Fig. 5). (The remaining 1 % made landfall in Shandong Province.) While there are some hotspots that develop due to the distribution of major population centers, the authors and dataset were generally able to account for that. Nevertheless, most of the southern coast has a high density of TCs. Along the eastern coast, landfalls were densest toward the north, leaving a long stretch where landfalls are relatively sparse.
Temporal Patterns of Tropical Cyclones
Normally, I like to keep space and time together, but I wanted to separate them because this is where the study gets especially noteworthy. Below is a time series of tropical cyclone activity for both regions (Fig. 5). Panel 5A shows the average number of TCs in each region. I am still unclear on the negative values, unless it is actually a departure from normal, but that is not stated in the text. Regardless, there are two major takeaways. First, there are distinct periods when variability is low (e.g., most of the 1500s). Conversely, there are periods when variability tends to be elevated (e.g., the 1600s). A lot of the variability seen here highlights patterns over a variety of timescales, particularly at (multi)decadal and centennial intervals. In essence, there are prolonged periods when tropical cyclone activity is heightened and vice versa. The second feature that stands out is the distinct increase in tropical cyclone count during part of the Maunder Minimum (bounded by the vertical dashed lines). During this period, the mean number of TCs was about 57 % higher than along the South coast compared to any other point outside of the Maunder Minimum. The change along the East coast was not widespread, and there were comparable increases in activity at other times. Nevertheless, there was still an increase in the mean number of TCs. (For the record, these changes were statistically significant, per the results of their t-tests.)
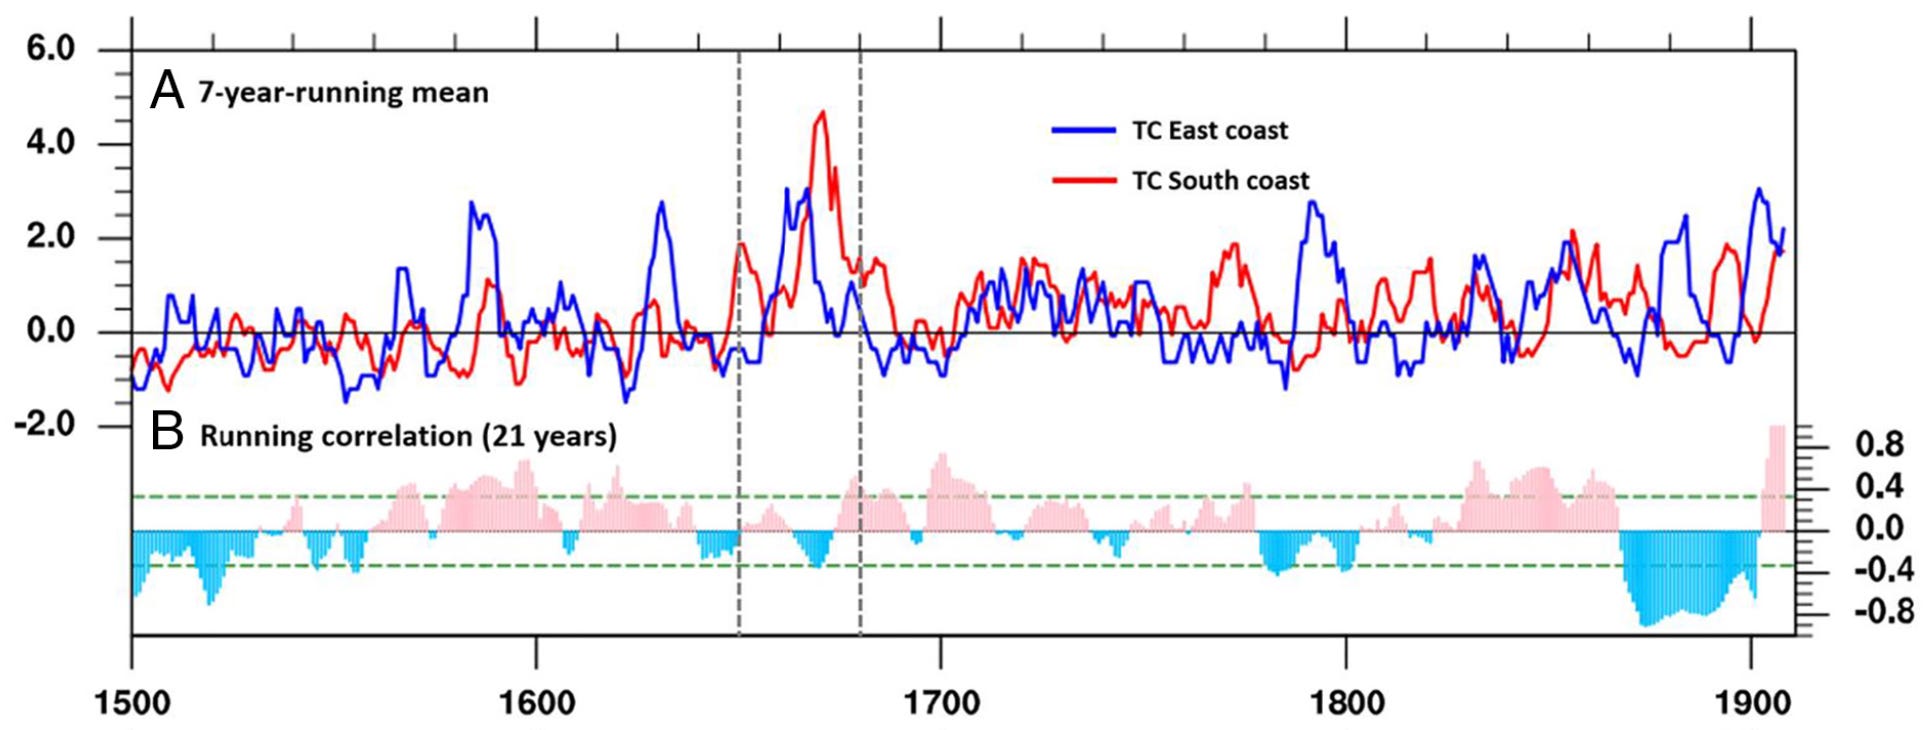
Another interesting feature of this record are the intervals during which the coasts are in phase and out of phase with one another (Fig. 5B). Generally, the two coast are positively correlated (red), meaning that both coasts experience the same changes in tropical cyclone activity. However, there are notably long intervals during which the two are inversely correlated (blue), i.e., the changes in activity along each coast are opposite of one another. Interestingly, during the Maunder Minimum, there seems to be a rapid shift in correlations, going from positive to negative before shifting to a period of heightened direct correlations. To me, this suggests a change in circulation (more on that later), which could indicate a distinct boundary for tropical cyclone populations. (Similar to how we would divide the Gulf of Mexico into the Eastern and Western Gulf.) As an aside, I think it would be interesting to explore the variability, including the dramatic shifts in magnitude, throughout the time series in more detail because there seems to be a lot of it.
The above are not the only temporal changes to tropical cyclone activity. As it turns out, there were also seasonal shifts in storms during the Maunder Minimum (Fig. 6). Whether there is a distinct typhoon season in the western North Pacific is up for debate (I tend to lean toward there not being a distinct season. per se, unlike the North Atlantic. Rather, there’s just a period of fewer storms. This does not come across when zoomed into a particular region.) As the instrumental record in both panels of Figure 6 demonstrates, the peak in storm activity occurs in August and September for the East and South coasts, respctively. The South coast also has a longer period of activity (Fig. 6B). This pattern is, more or less, seen in the reconstruction (1500–1911 CE, excluding the Maunder Minimum).
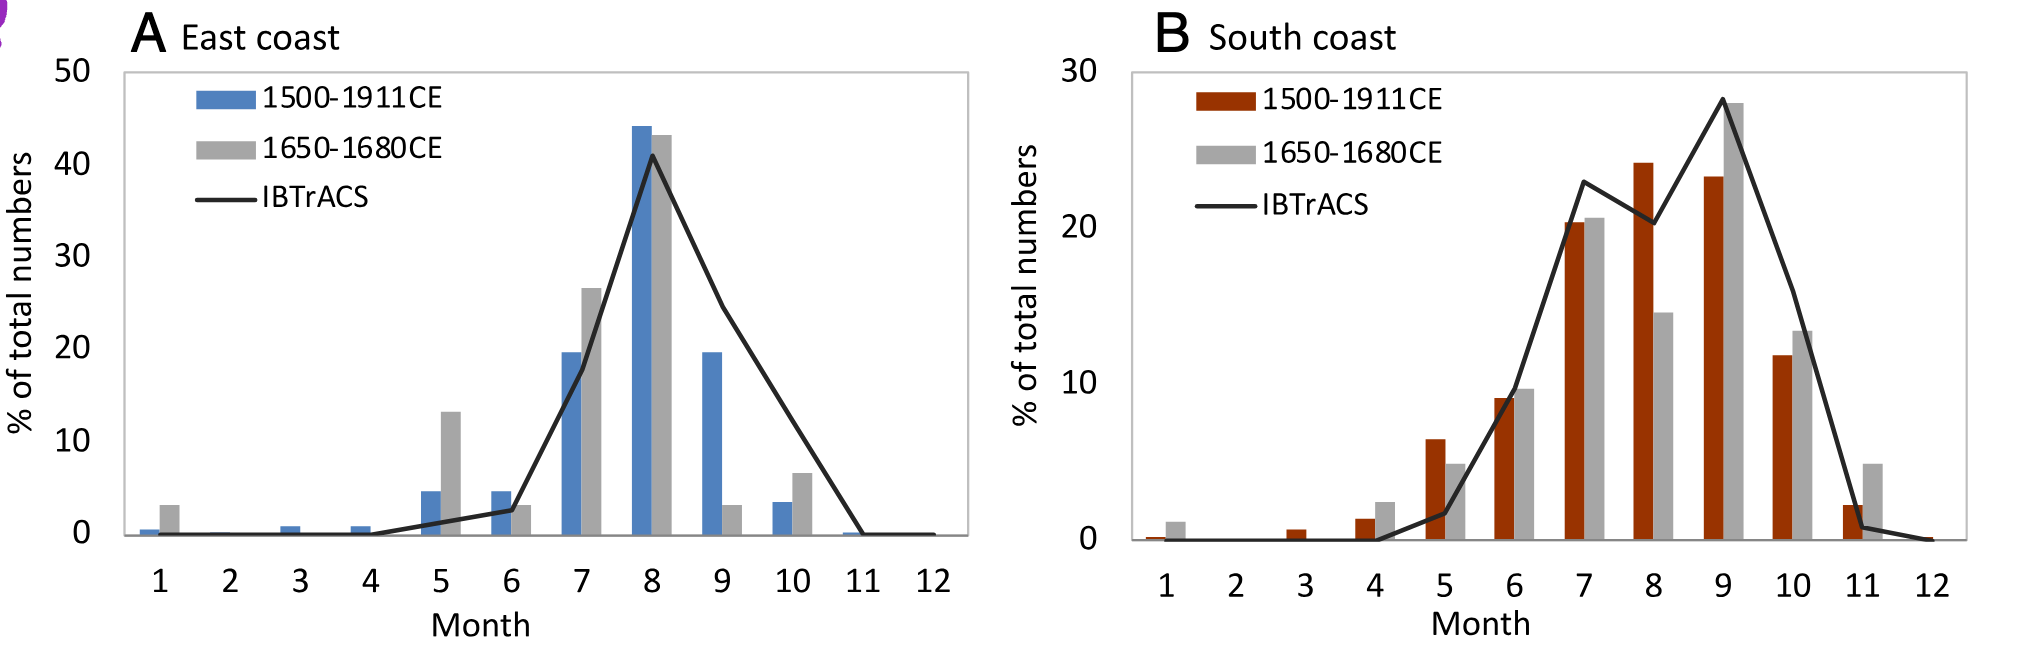
However, when you look at storm activity during the Maunder Minimum, you can see a series of shifts in seasonality. Along the East coast (Fig. 6A), for example, there is a dramatic reduction in storms in September, while July sees a notable increase in events. (The peak in August remains largely unchanged.) The changes along the South coast (Fig. 6B) generally show increases, especially in September, with the exception of August, which exhibits are distinct decline in activity. It is interesting that there seems to be a fair amount of nuance in these changes, though it should not come as a surprise, considering what we see in Figure 5B. One last thing to point out before moving on to the causes is that the changes seem to exhibit both an increase in storm activity as well as a larger distribution of the timing of storms. In essence, there is a shift in the length of typhoon season.
What is the Cause?
There are a lot of factors at play here, but I think the primary two are temperature and volcanic eruptions (Fig. 7), especially in relation to the thermal properties of the atmosphere/land and ocean (Fig. 7D). Volcanic eruptions are going to change the amount of solar radiation that reaches the surface due to the aerosols that are ejected into the atmosphere. Because they block much of what reaches the planet, cooling occurs. The thermal properties of the atmosphere (and land) are very different from the ocean, but the two most important characteristics are heat capacity and timescale. The ocean has a much higher heat capacity than the atmosphere, meaning it can hold onto more heat than the latter. It also takes longer to change than the atmosphere, which is why the peak in the North Atlantic hurricane season occurs after we have reached the peak in air temperatures in the Northern Hemisphere. the water is still warm.
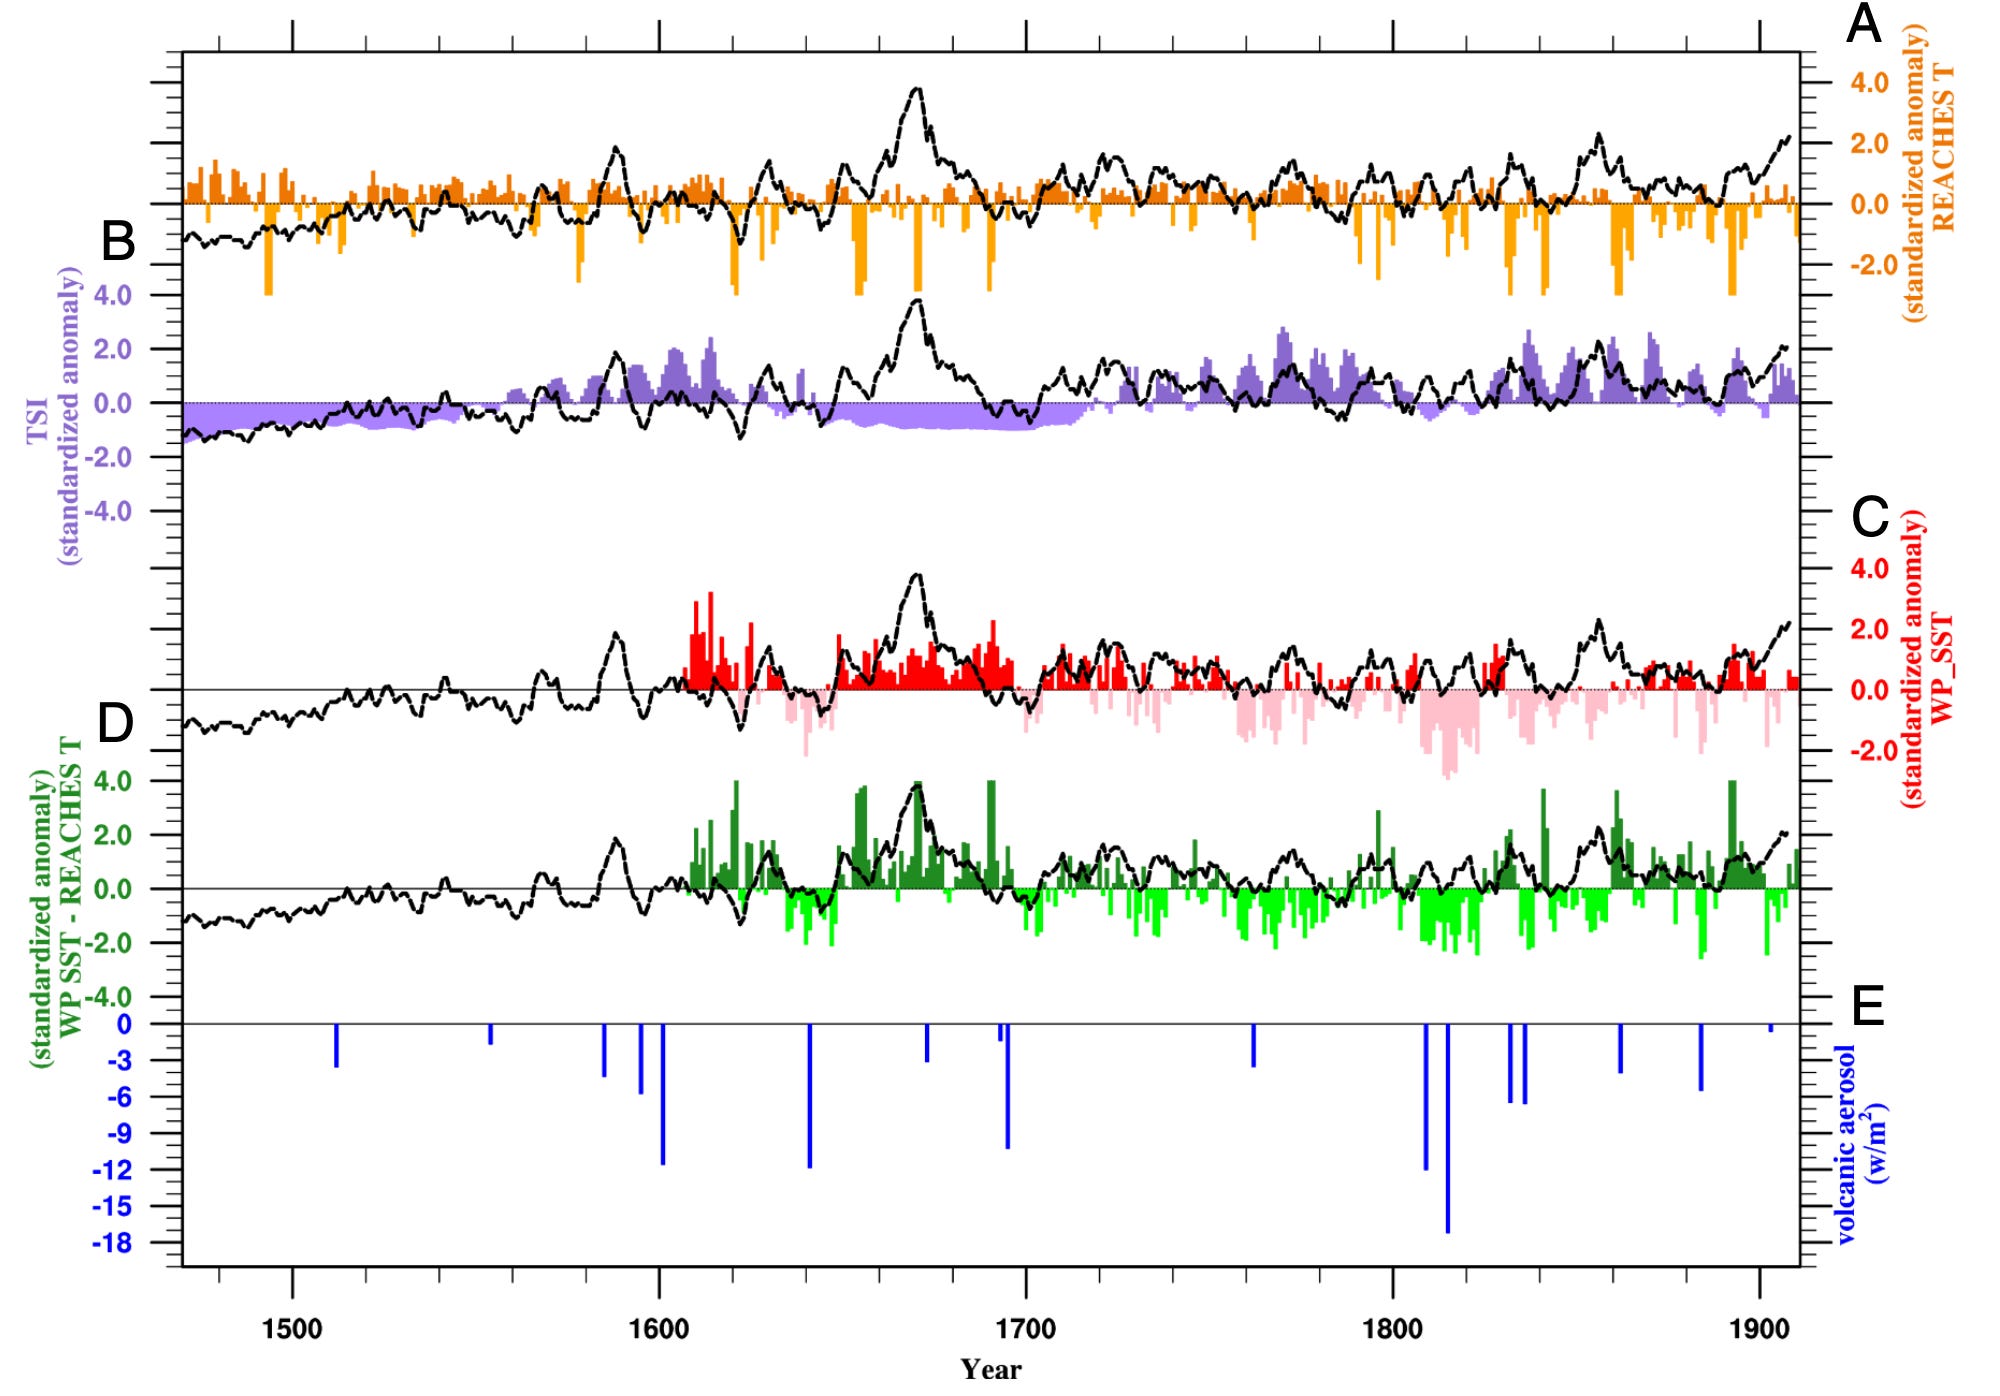
When you have this heat differential, this can dramatically alter circulation patterns, monsoon circulation in particular. (This is arguably one of the most important factors that drive monsoon formation.) An enhanced monsoon can be important for generating and steering TCs. So, despite the global temperatures being cooler during the Maunder Minimum (and during the Little Ice Age) due, in part, to changes in solar activity as well as volcanic eruptions, the lag between the air and sea may have created a stronger temperature gradient that strengthened (monsoonal) circulation. The dividing line of this would have fallen roughly between the South and East coasts of China. This entire idea is shown in Figure 8 below. (Side note: conceptual figures are truly wonderful in papers. If you are looking for the core concepts and main takeaway, look for the conceptual figure.) The authors are clear, however, that this would need to be explored in more detail. (This is something that I frequently find myself saying because we are making our best conclusions using the data we have. We need more data (i.e., more reconstructions), and we need more collaborations between the proxy users and modelers.)
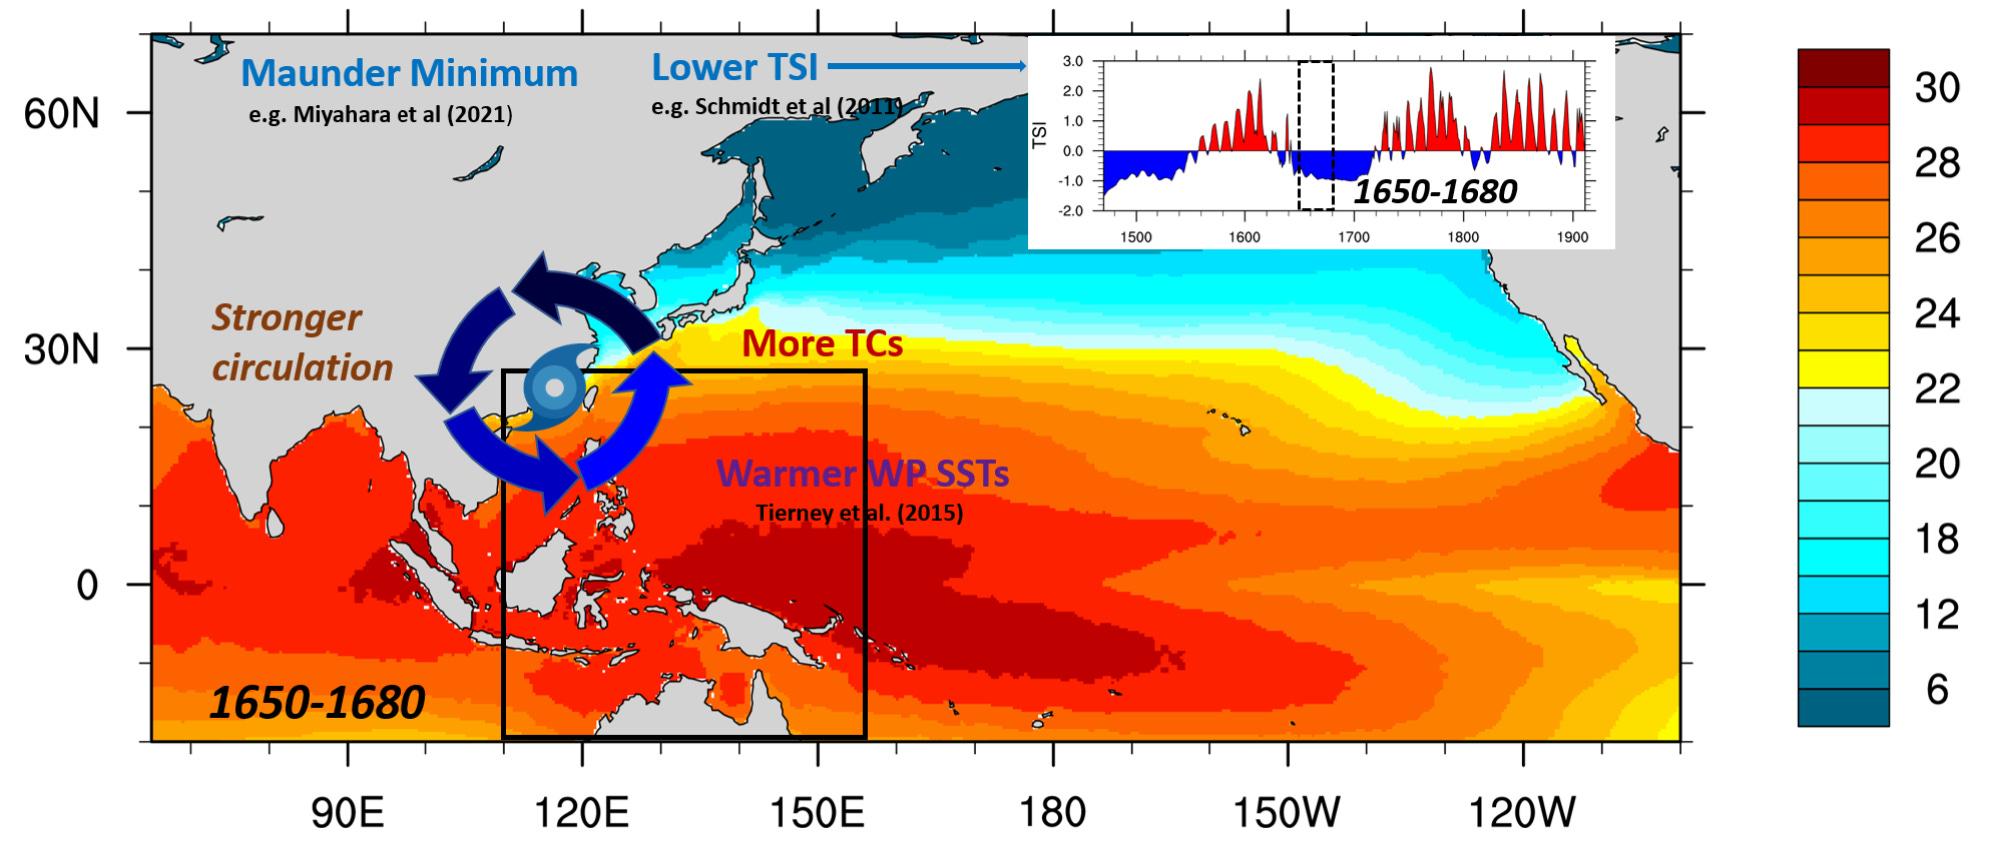
So, that is the working idea: the temperature gradient strengthened monsoon circulation, which, in turn, directed more storms into the coast. I should note that the warmer waters would also help with tropical cyclone formation. Overall, conditions were particularly favorable for storm development, and with more storms (combined with changes in circulation) you can get more landfalls.
Conclusion
I found this paper to be fascinating and useful. In fact, it actually generated a couple of ideas that I would like to explore in my own research (not going to mention them here for fear of being scooped). This paper was also a great demonstration as to why we need to reconstruct TCs, especially during notable climatic intervals, such as the Maunder Minimum. This is critical for understanding the climate dynamics that are important for driving tropical cyclone variability and will be key to preparing for these storms as the world continues warming.
Until next time.
References
[1] K.E. Lin, et al., Intensified tropical cyclone activity in East Asia during the Maunder (solar) Minimum, Proc. Natl. Acad. Sci. U.S.A. 122 (52) e2419759122, https://doi.org/10.1073/pnas.2419759122 (2025).
[2] Lean, J. L., Cycles and trends in solar irradiance and climate, WIREs Clim. Chan. 1, 111–122 (2010). https://doi.org/10.1002/wcc.18
[3] Solanki, S., et al. Unusual activity of the Sun during recent decades compared to the previous 11,000 years. Nature 431, 1084–1087 (2004). https://doi.org/10.1038/nature02995
[4] Chen, H.-F., et al. China’s historical record when searching for tropical cyclones corresponding to Intertropical Convergence Zone (ITCZ) shifts over the past 2 kyr. Clim. Past 15, 279–289 (2019). https://doi.org/10.5194/cp-15-279-2019